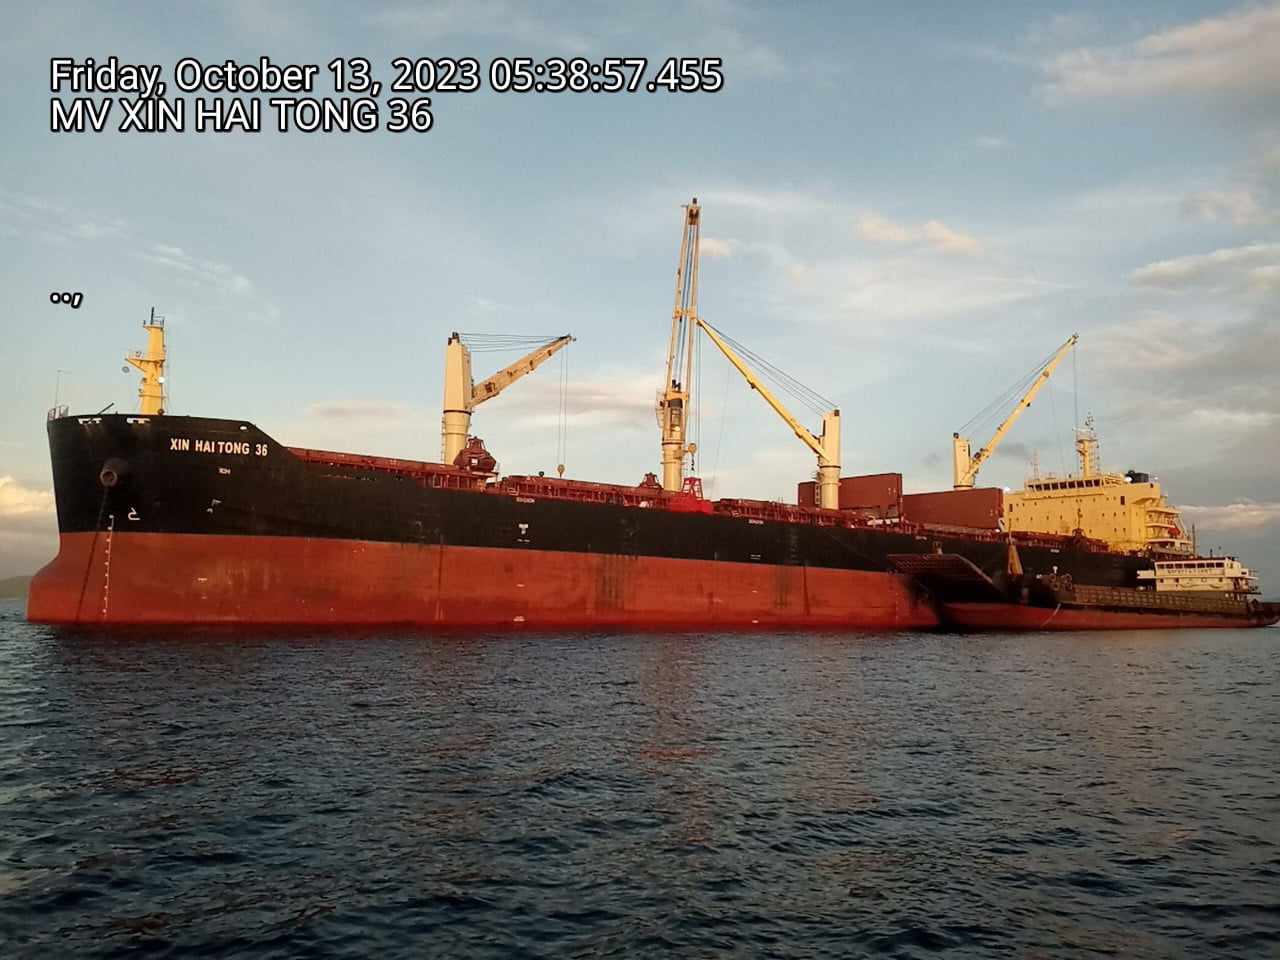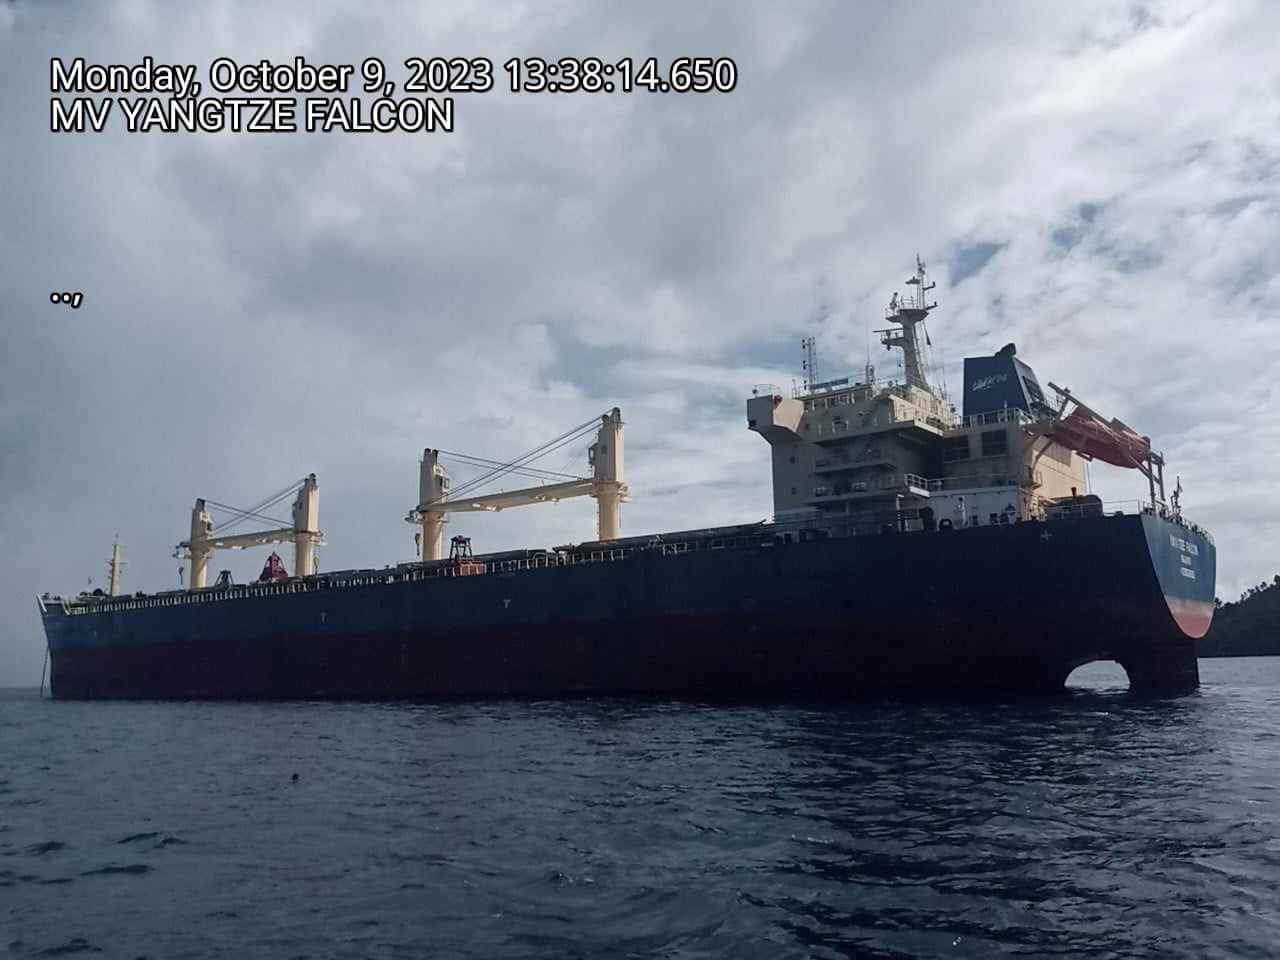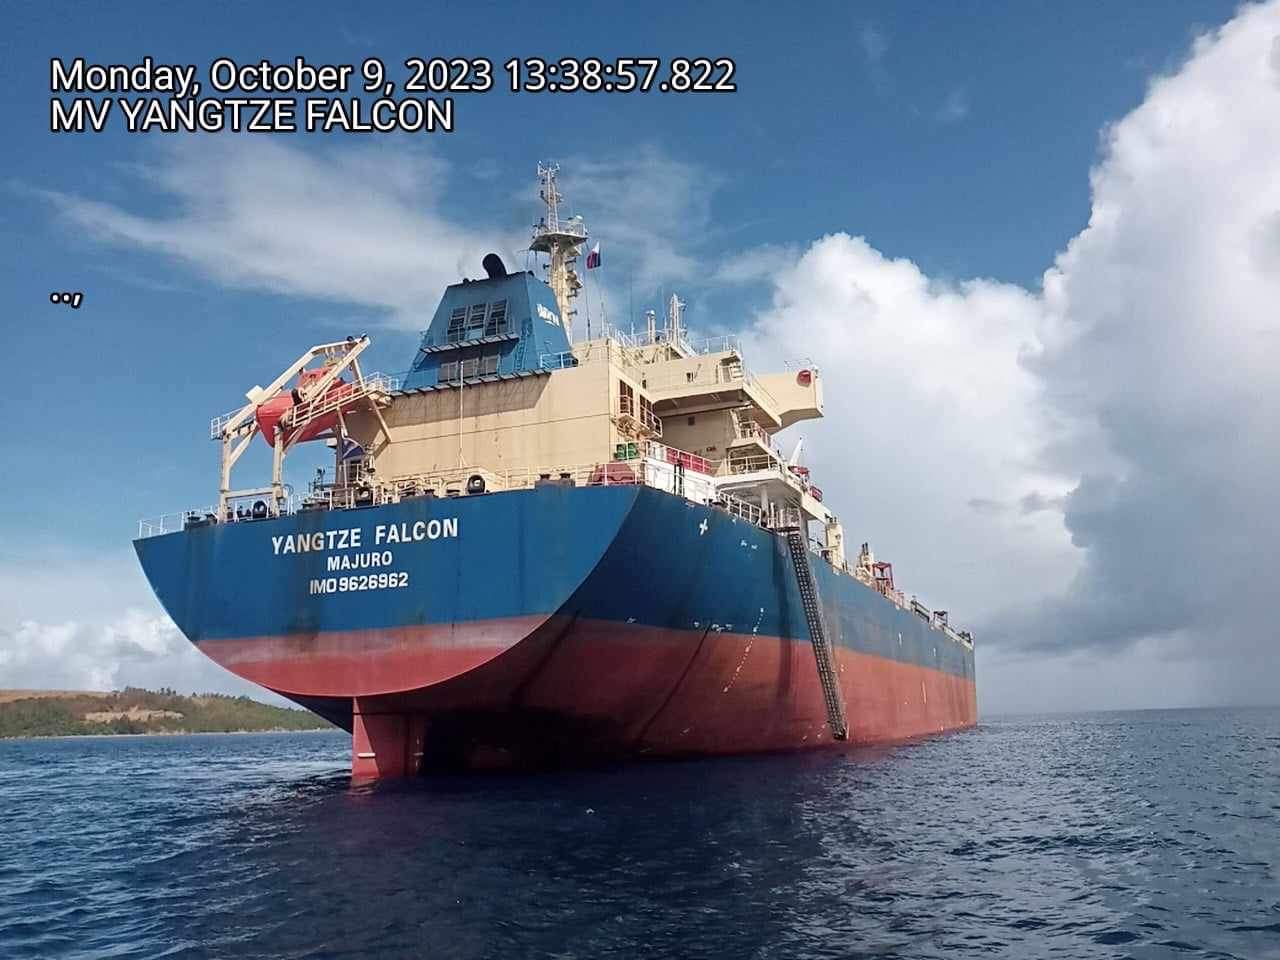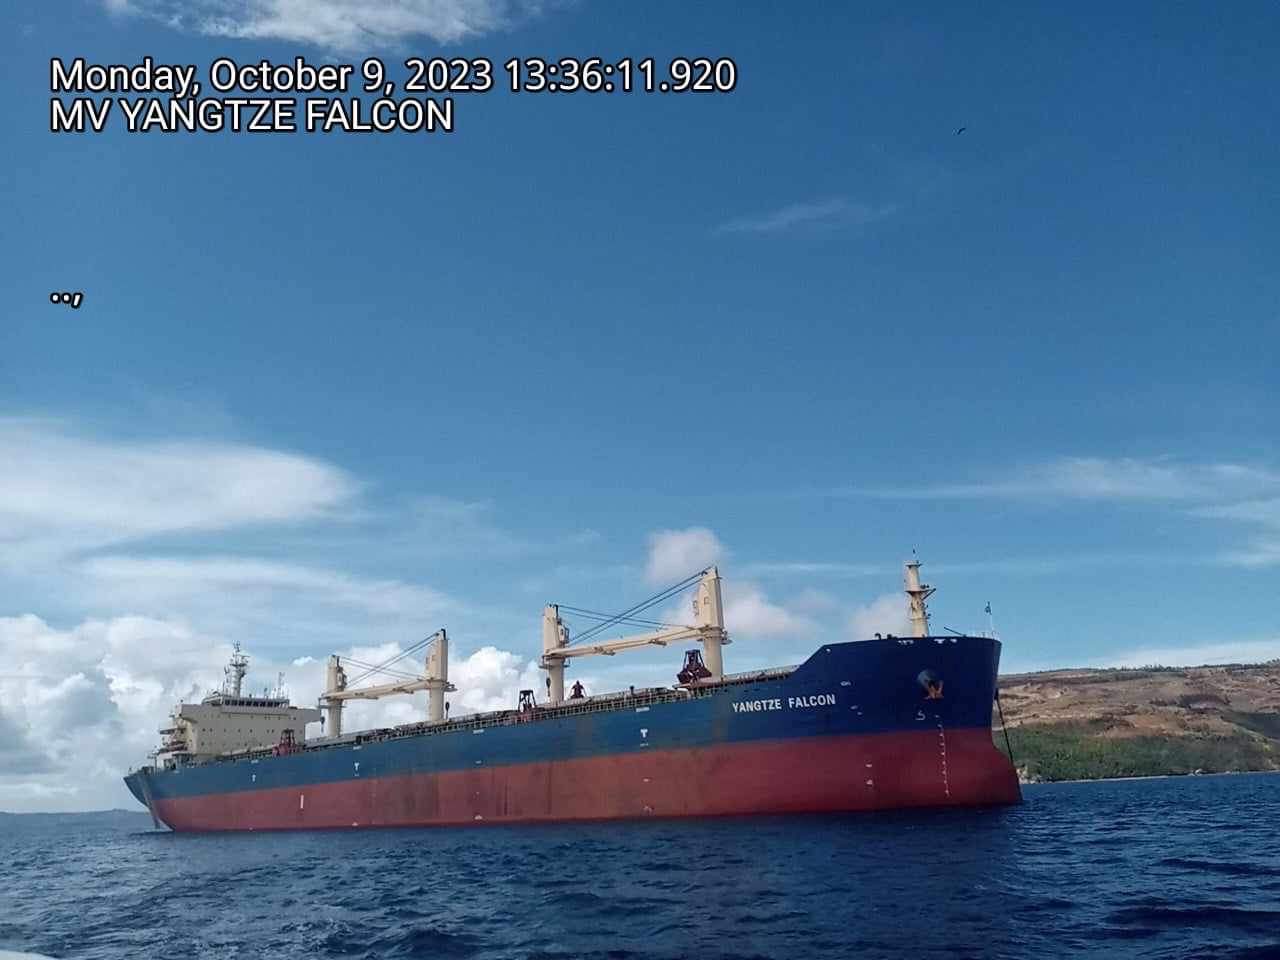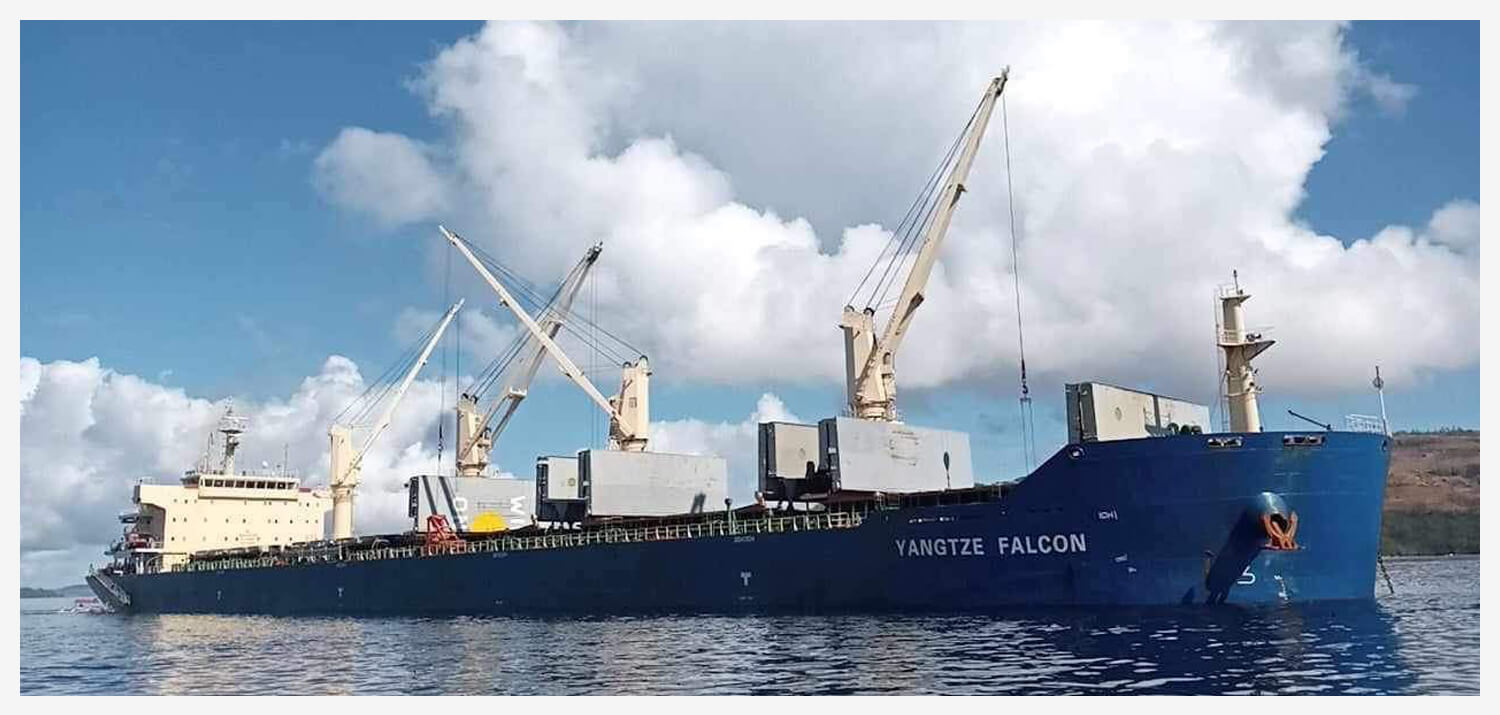
The Caraga mining industry remains to be a significant contributor to the country’s economic development as well as in the foreign-exchange earnings through the mineral exports. As of 3rd quarter of the current calendar year, the Mines and Geosciences Bureau Regional Office No. XIII presents the partial and unreconciled Metallic Mineral Resources Data on Sales of the 18 Nickel mines, two (2) Gold with Silver mines, and one (1) processing plant.
Table 1 – Metallic Mineral Resources Data on Sales of the operating/producing mines covering the period of January to September of CY 2023
| Item No. | Mineral Commodity | No. of Shipments | Actual Volume | Gross Sales Value (in PhP) |
| 01 | Nickeliferous Ore | 454 | 25,424,197.55 WMT | 32,776,535,678.09 |
| 02 | Gold Doré | 20 | 1,569.65 kg | 5,515,894,553.11 |
| 03 | Silver Doré | 14 | 683.36 kg | 30,885,767.98 |
| 04 | Nickel/Cobalt Mixed Sulfides | 10 | 47,183.449 WMT | 24,971,411,586.31 |
| 05 | Scandium Oxalate | 10 | 23,003.80 wkg | 296,954,828.31 |
| 06 | Chromite | 2 | 54,229.20 WMT | 847,781,051.87 |
(Note: Mining Contractors/Operators/Permit Holders are yet to submit to this Office the complete shipment documents.)
Overall metallic mineral sales volume increased during the reference period. Nickeliferous ore, nickel/cobalt mixed sulfides and chromite sales volume grew positively by 0.33%, 15.66% and 1.38%, respectively. On the other hand, sales volume on gold doré, silver doré and scandium oxalate declined. In terms of total gross sales value, commodity shipments have decreased approximately by 8.37% from PhP70.33 Billion in January to September of CY 2022 to PhP64.44 Billion in January to September of CY 2023. The sales value for nickeliferous ore, gold doré and scandium oxalate fell while silver doré, nickel/cobalt mixed sulfides and chromite showed positive growth.
| Mineral Commodity | Volume Jan-Sep 2022 | Volume Jan-Sep 2023 | Volume % Change | Gross Sales Value (in PhP) Jan-Sep 2022 | Gross Sales Value (in PhP) Jan-Sep 2023 | Gross Sales Value (in PhP) % Change |
| Nickeliferous Ore (WMT) | 25,341,396.08 | 25,424,197.55 | 0.33 | 39,846,925,107.93 | 32,776,535,678.09 | (17.74) |
| Gold Doré (kg) | 1,778.48 | 1,569.65 | (11.74) | 5,867,771,600.79 | 5,515,894,553.11 | (6.00) |
| Silver Doré (kg) | 844.49 | 683.36 | (19.08) | 27,296,408.31 | 30,885,767.98 | 13.15 |
| Nickel/Cobalt Mixed Sulfides (WMT) | 40,794.06 | 47,183.449 | 15.66 | 23,511,611,899.56 | 24,971,411,586.31 | 6.21 |
| Scandium Oxalate (wkg) | 23,153.30 | 23,003.80 | (0.65) | 413,255,707.95 | 296,954,828.31 | (28.14) |
| Chromite (WMT) | 53,493.47 | 54,229.20 | 1.38 | 660,844,398.95 | 847,781,051.87 | 28.29 |
| Total | 70,327,705,123.48 | 64,439,463,465.67 | (8.37) |
Some of the significant factors in the decline of the metallic sales value include the (1) absence of production from two Mining Contractors/Operators as they transitioned to the Final Mine Rehabilitation and/or Decommissioning Program, (2) decrease in the prices of nickel and scandium oxalate, and (3) disruptions of mining operations due to prolonged unfavorable weather conditions in the region.
